Catalyst
An internal operations app for small businesses — designed to give owners and field teams one place for projects, people, payroll, and schedule.
Project Overview
Role: Product designer & builder
Process: Figma Make → iteration → VS Code with Cursor
Platform: Responsive web / mobile-first operations dashboard
Problem: Small teams often juggle spreadsheets, texts, and separate tools for jobs, expenses, and staffing. Context gets lost between the office and the field.
Goal: Create a clear operations hub for roles like Owner, Office Manager, Project Manager, and Field Employee — with a dashboard that surfaces revenue, expenses, profit, and active work at a glance.
From Sketch to Structure
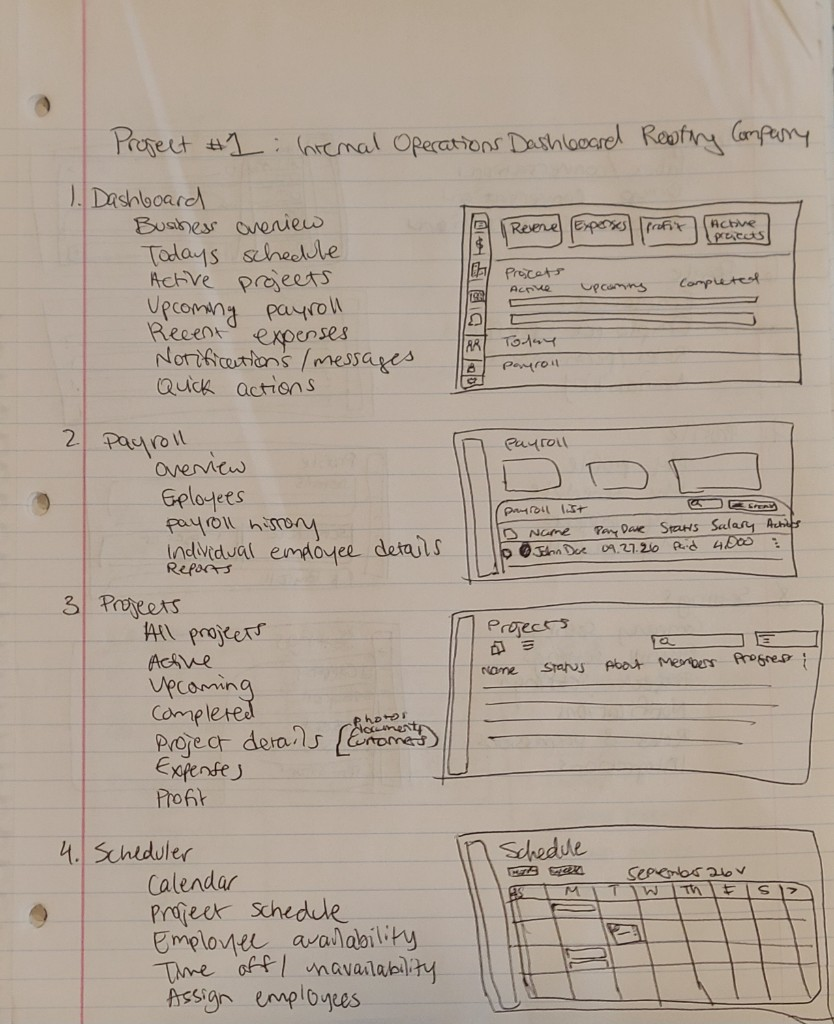
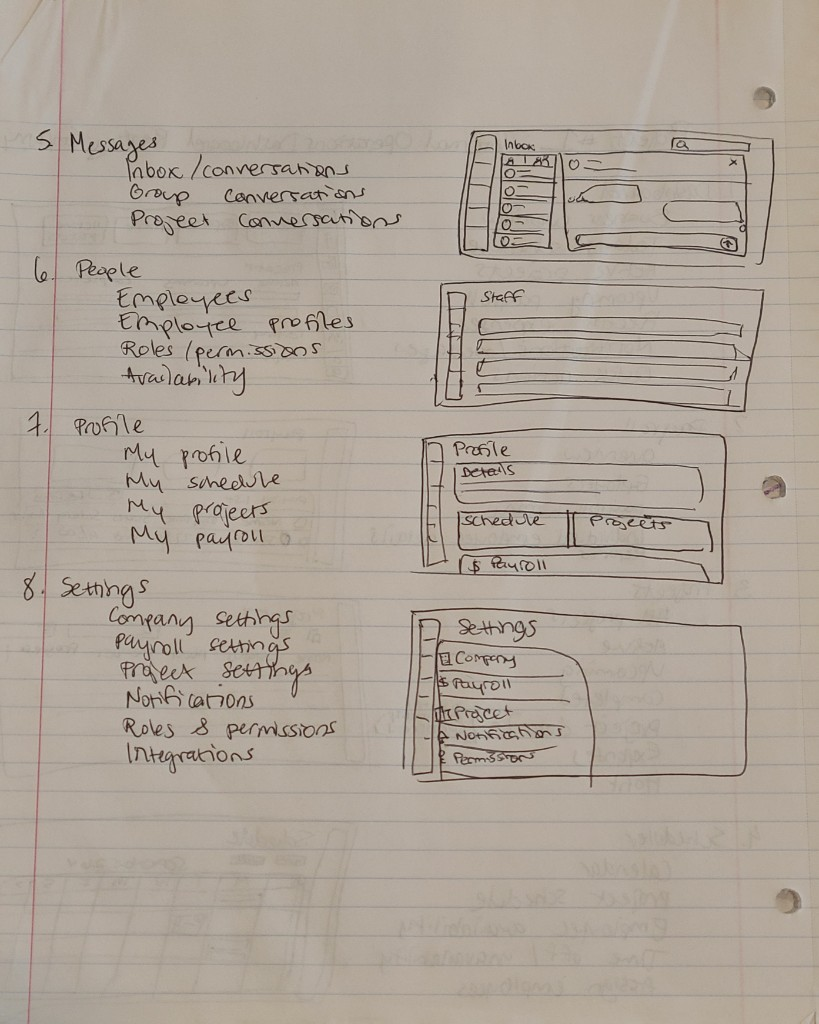
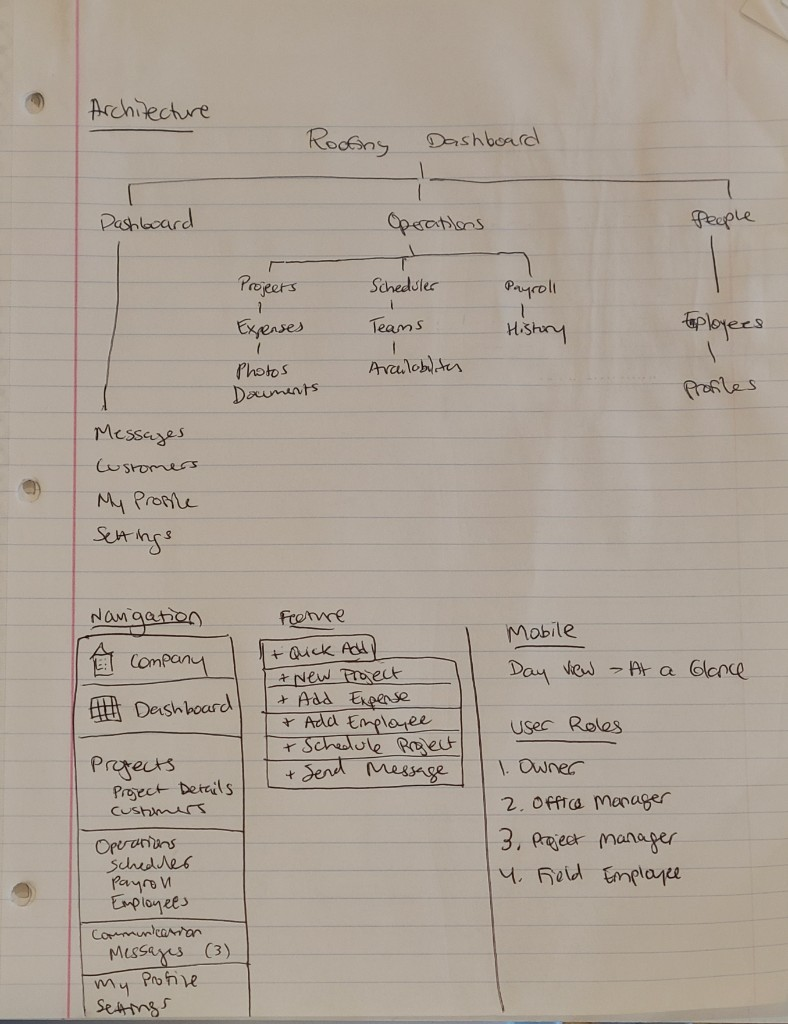
I started on paper: mapping information architecture for Dashboard, Operations (Projects, Scheduler, Payroll), People, Communication, and Settings, plus role-specific needs like a mobile day view for field staff.
Iterating the Design: Mobile Dashboard Before & After
An early iteration stacked KPI cards and a long project list. The refined version clarifies trends vs last month, highlights active work, and uses tabs plus stronger primary actions for faster scanning.
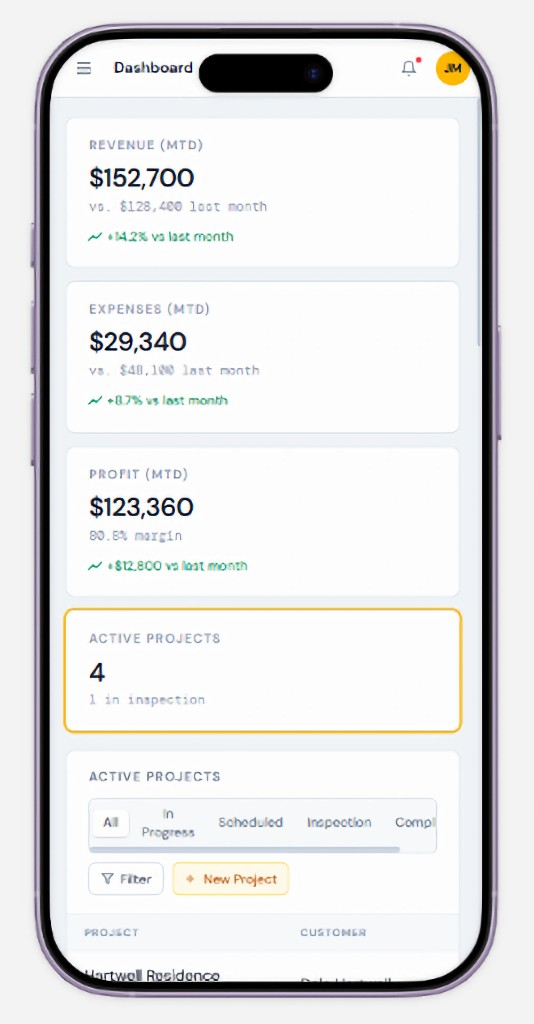
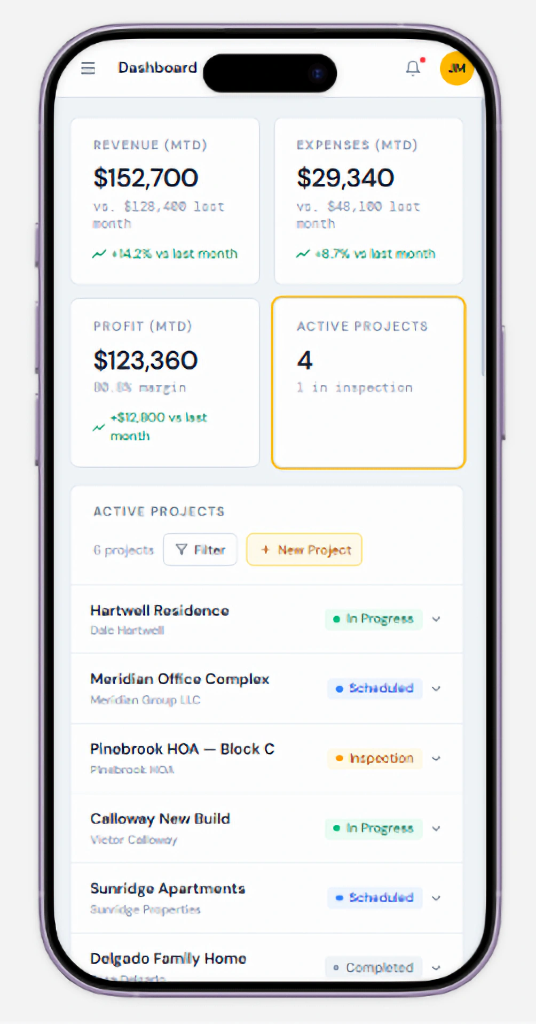
Drag to compare before and after.
Interactive preview
Click through the live Catalyst dashboard below — built and published from Figma Make.
Design → Build Loop
I explored and refined screens in Figma Make, then translated the system into a working product in VS Code using Cursor. That let me keep design and implementation close — tightening hierarchy, status language, and mobile density as real UI landed. For the implementation, I wanted to broaden the user base to any small business. I added a setup flow that allows owners of any field to sign up and eventually connect their quickbooks or payroll system.
What shipped in the UI
- Dashboard KPIs for revenue, expenses, profit, and active projects
- Project lists with status, filters, and quick create
- Role-aware navigation for office and field workflows
- Workspace onboarding with room to connect accounting later
Takeaways
Paper sketching allowed me to brainstorm and nail down the layout structure quickly. Figma Make accelerated exploration; Cursor helped me close the gap between design intent and production UI. The biggest win was iterating mobile density until the dashboard felt scannable in the field — not just polished on a desktop canvas.